
20261020
Below is a chart showing diesel prices against Ukraine’s strikes on Russia refineries and events around the US/Iran conflict.
I have seen the chart in a number of places and it seems to be attributed to the ISW (Institute for the Study of War). I did a number of searches on their website (https://understandingwar.org) and could not find it. I also tried to search ex-Twitter because there seemed to be some indications that they had posted it there but I could not find it. That may be because I am not an ex-Twitter subscriber and my searches may be limited. However, I believe the ISW is the source of the chart.
I will post a screen capture of the chart here (with colored rectangles that I have added) and then will explain the rectangles below the chart.
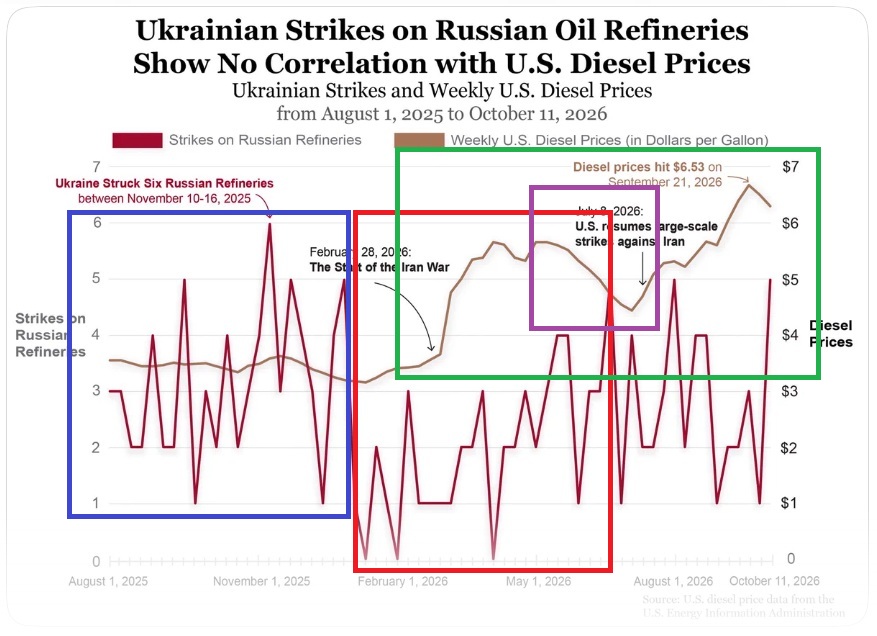
The line that appears kind of tan or brown to me are the oil prices and the line that appears to be kind of a burgundy color to me are the number of Ukrainian strikes against Russian refineries.
So, the chart shows that even though Trump likes to try to blame Ukraine for the high oil prices and to claim that they do not have anything to do with his attack on Iran. The facts clearly show that the major contributor is Trump’s conflict with Iran.
I love charts and believe that they can reveal things that may not be as evident just looking at a bunch of numbers. I also believe that this chart from the ISW is well done. However, reading charts is, in my opinion, part math or science but also in large part an art. I know many people who just go glassy eyed when presented with a chart. For those reasons I will present here some observations from looking at the chart that I hope will help people understand it.
In the blue box we see that during the second half of 2025, during a period when Ukraine’s strikes on Russian refineries was at a relatively high level, the price of diesel stayed quite steady with a slight decrease near the end of that period.
In the red box we can see that during the first half of 2026, during a period when Ukraine’s strikes on Russian refineries were lower the price of diesel increased.
The green box shows the period in which the diesel prices rose, which also happens to be the period during which the US conflict with Iran occurs. The two sharpest rises come right after Trump attacked Iran and then again after Trump resumed large-scale attacks on Iran after a bit of a ceasefire.
The purple box shows how, during the period of general rise outlined by the green box, there was a period where the diesel price started falling back down. That retreat in the diesel prices corresponds with the limited ceasefire and reverses and starts rising again as the ceasefire appeared to be falling apart.
It is clear that Ukraine is not responsible for the rise in diesel prices and that Trump is very directly responsible.
Those are my observations. I hope that helps.